Last week, I gave a talk titled Compressing floating point data with Gorilla at Helsinki Python Meetup. There’s no recording, but here is a blog version of the slides.
Gorilla is a simple algorithm for compressing floats. It’s over a decade old and it’s not the state of the art anymore but since it sparked the development of a whole family of algorithms, it’s a great starting point for learning about this topic.
I had a lot of fun learning about this and I figured others would enjoy it as well. You get to learn a bit about floats, time series data, and data compression. I hope you like it!


Actually, don’t just read this blog, go subscribe!
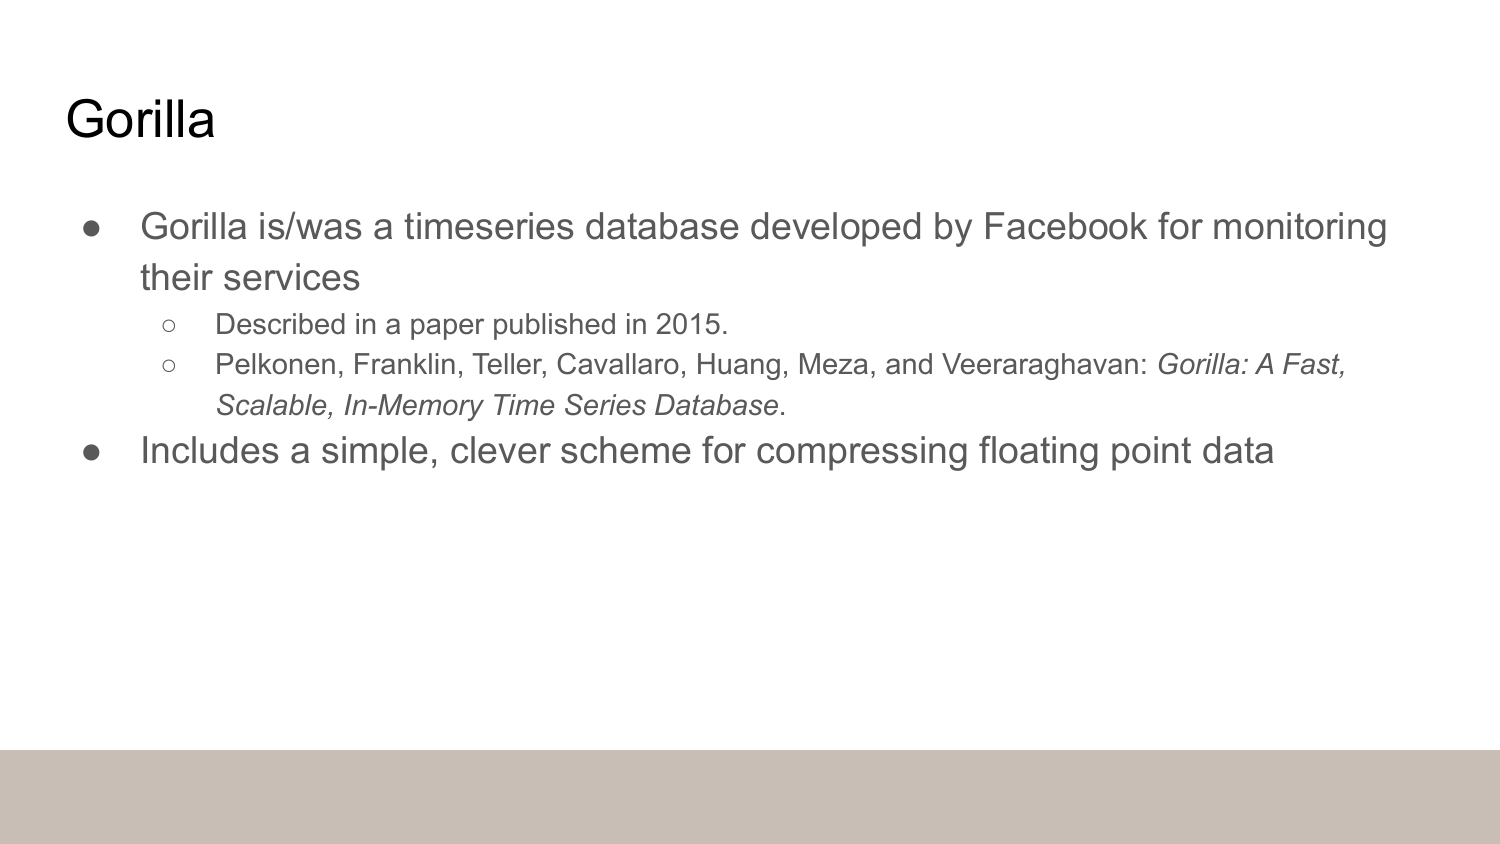
The talk title mentions the Gorilla algorithm, but the actual Gorilla was a time series database developed by Facebook. It was not ever made publicly available but they described it in a paper published in 2015.
They were trying to monitor web backends, including metrics like CPU load and network latency, and they wanted to be able to query recent data quickly. Because of this, they designed a new database that could hold the data in the memory. It was pretty much an observability tool, although they didn’t call it that back then.
To make the data fit in the memory, they came up with a simple but efficient encoding for the floats. This encoding is the algorithm that we’re talking about.
There are many general purpose compressing algorithms like DEFLATE and Zstandard. These algorithms need to work on any data you can throw at them. However, if you know something about the data you’re going to be compressing, you may be able to design an algorithm that is faster or compresses better or uses less memory than the general purpose algorithms.
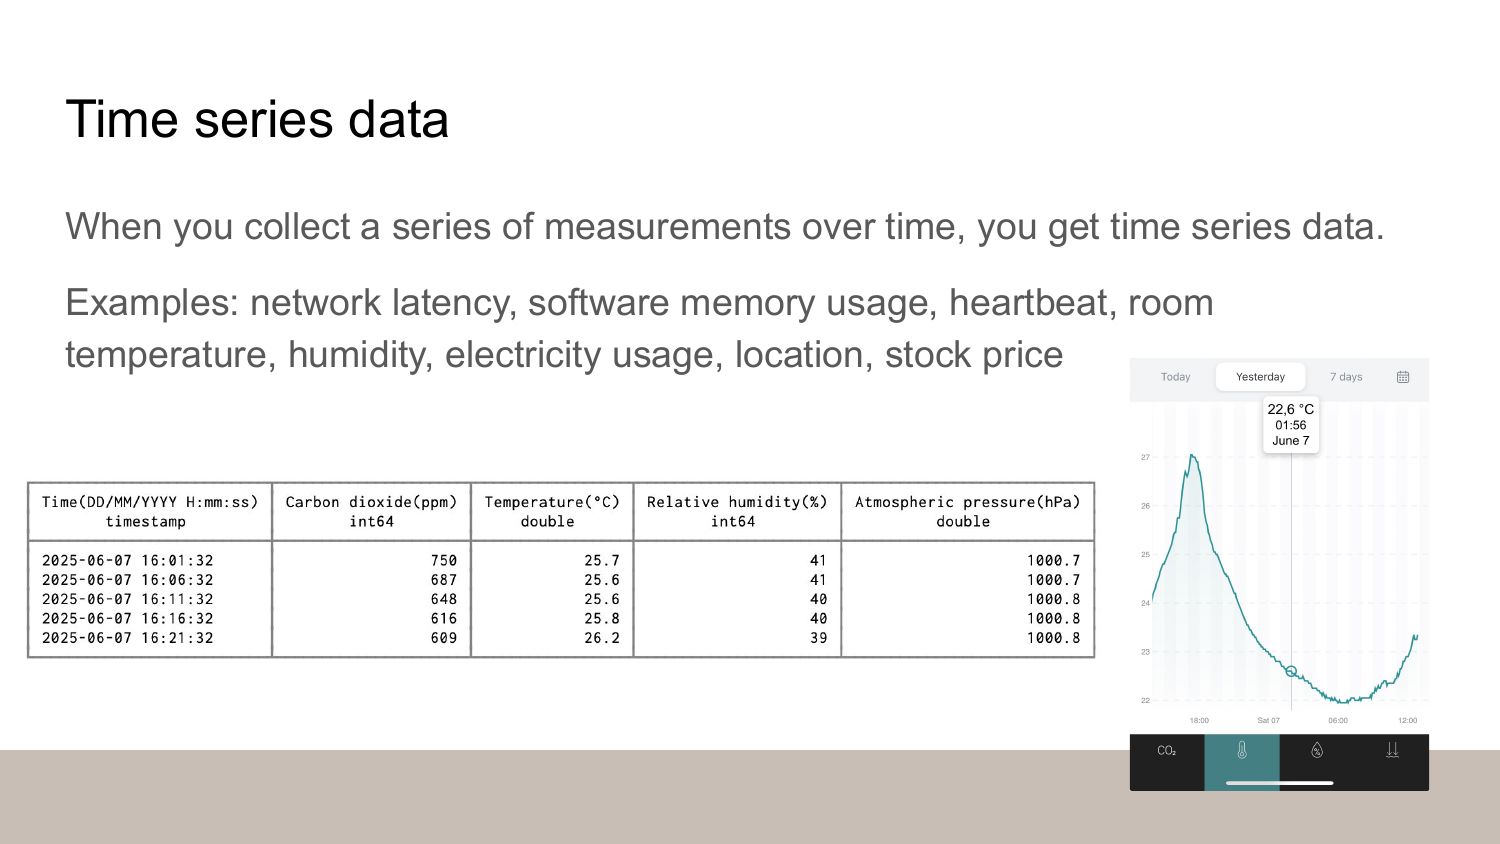
With Gorilla, we’re going to compress time series data, which is data where the data points are associated with a timestamp. Do we know anything about time series data that we could use?
One thing is that it’s often produced by some sort of slow process. For example, on the slides you can see some temperature data from my home. As you can see, the numbers are roughly the shame. The temperature changes slowly and within a limited range. It’s not going to suddenly jump to plus or minus hundred degrees.
Here’s an insight we need: in time series data, the consecutive values typically resemble each other and stay within a narrow range.

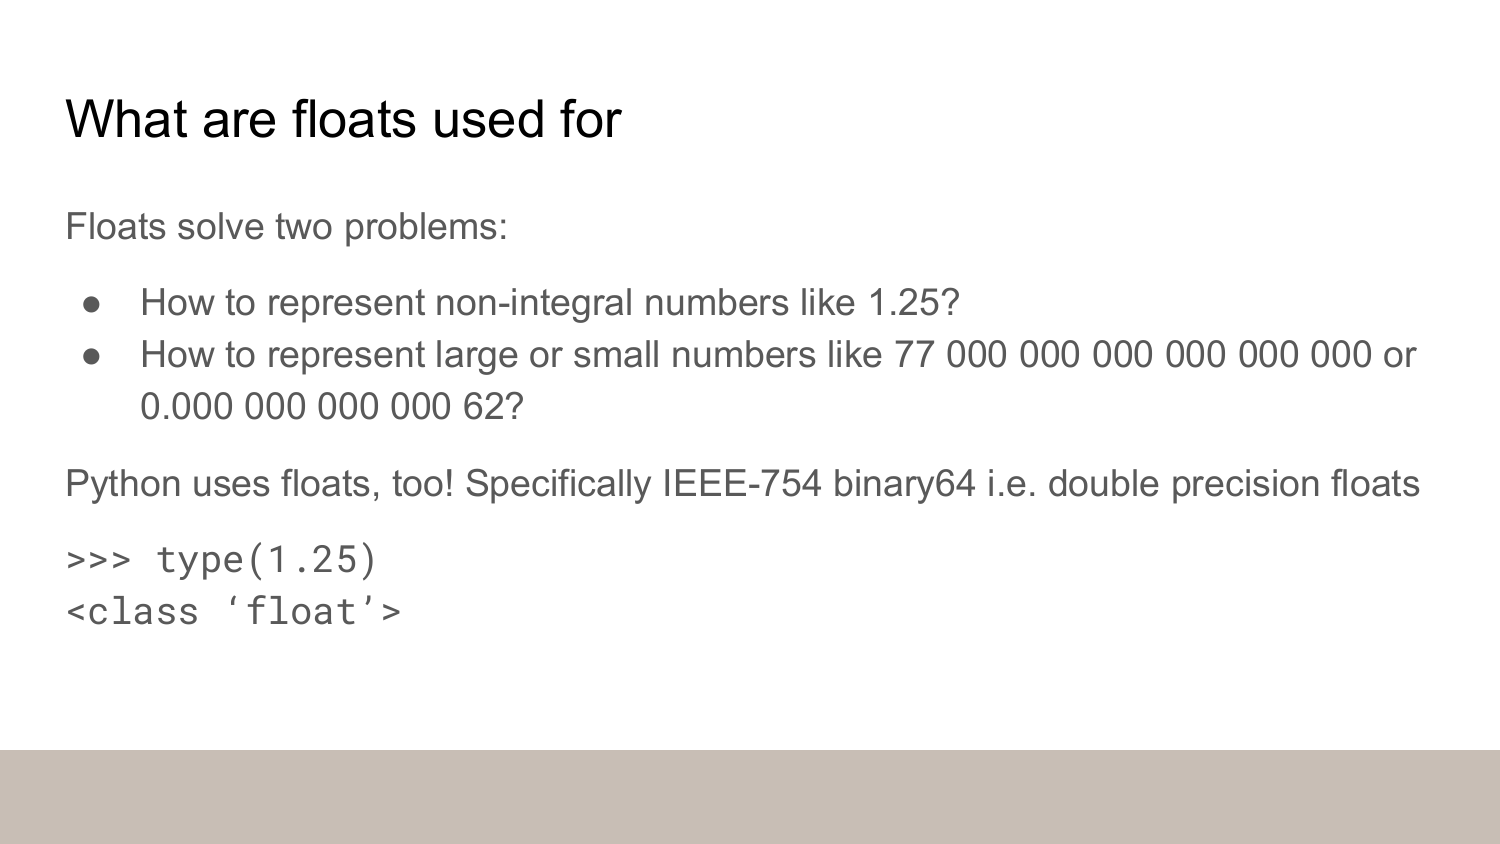
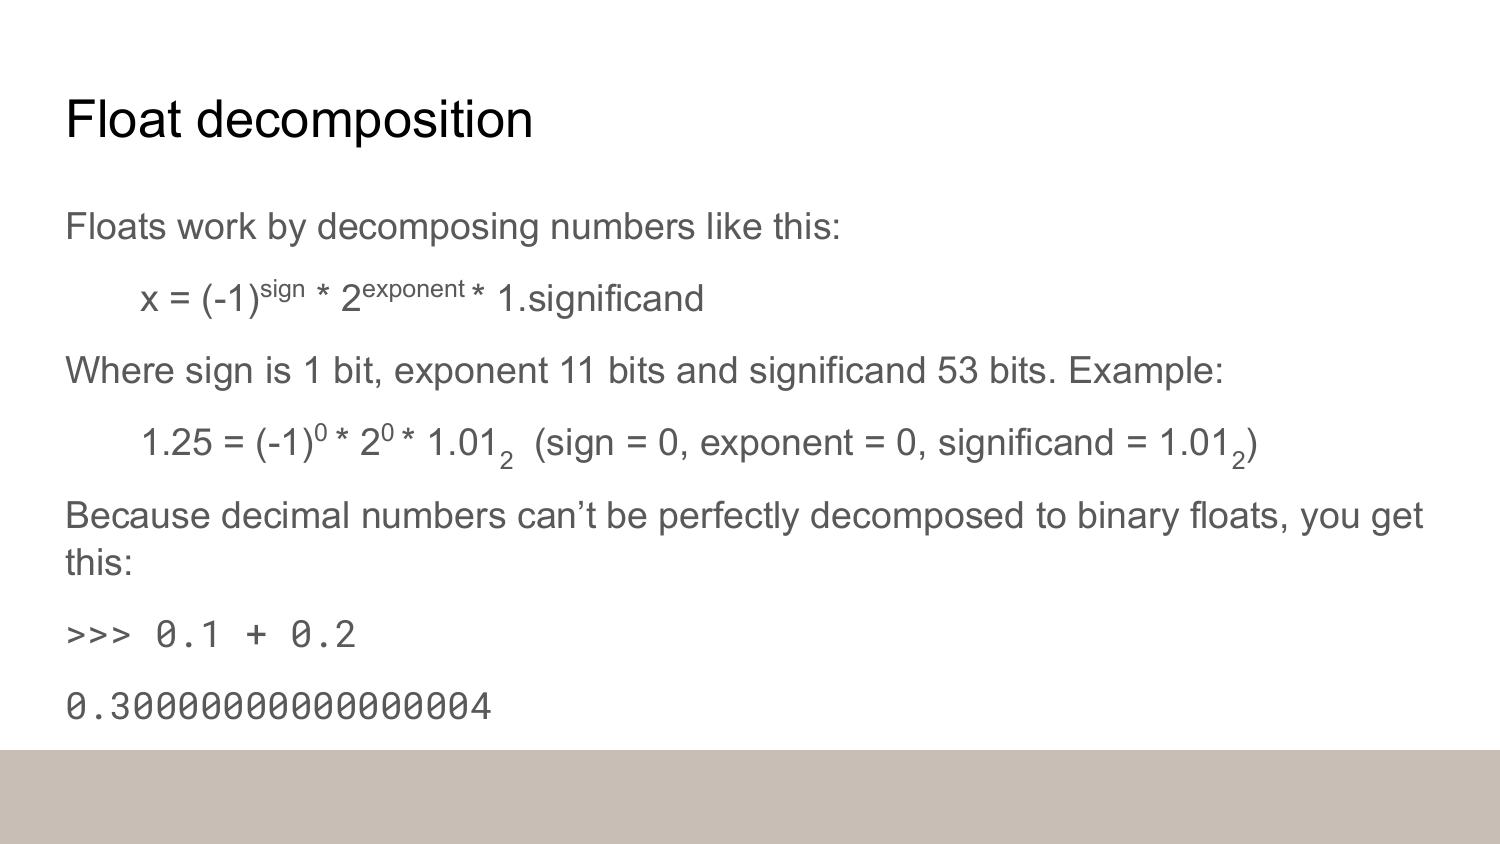
Before we can talk about the algorithm itself, we need know a bit about how floats work.
Link: https://float.exposed/0x3ff0000000000000
float.exposed is a web playground for seeing how computers represent the floats. You can enter a float at the top and it shows you the bits and the decomposition.
You can click the bits to toggle them.
- See what happens when you toggle the sign bit (marked with red underline).
- See what happens when you increase or decrease the exponent.
- Toggle the bits in the significand (marked with blue underline) and see if you can do the binary math in your head to verify the result.
Try entering 1.25.
The slides said that the exponent would be 0 but float.exposed says it’s 1023.
That’s because the value is biased.
You have to subtract 1023 to get the actual exponent.
This is what allows us to store negative exponents in that fields - try entering 1 in the exponent and see what you get.
We don’t have to remember all of this to understand Gorilla. However, it’s good to notice that the sign bit and the exponent come first. This means that if we’ve got a bunch of numbers that a roughly the same, and they aren’t right around zero, the left-hand side of their bit representations is going to be roughly the same as it’s only the significand that changes.
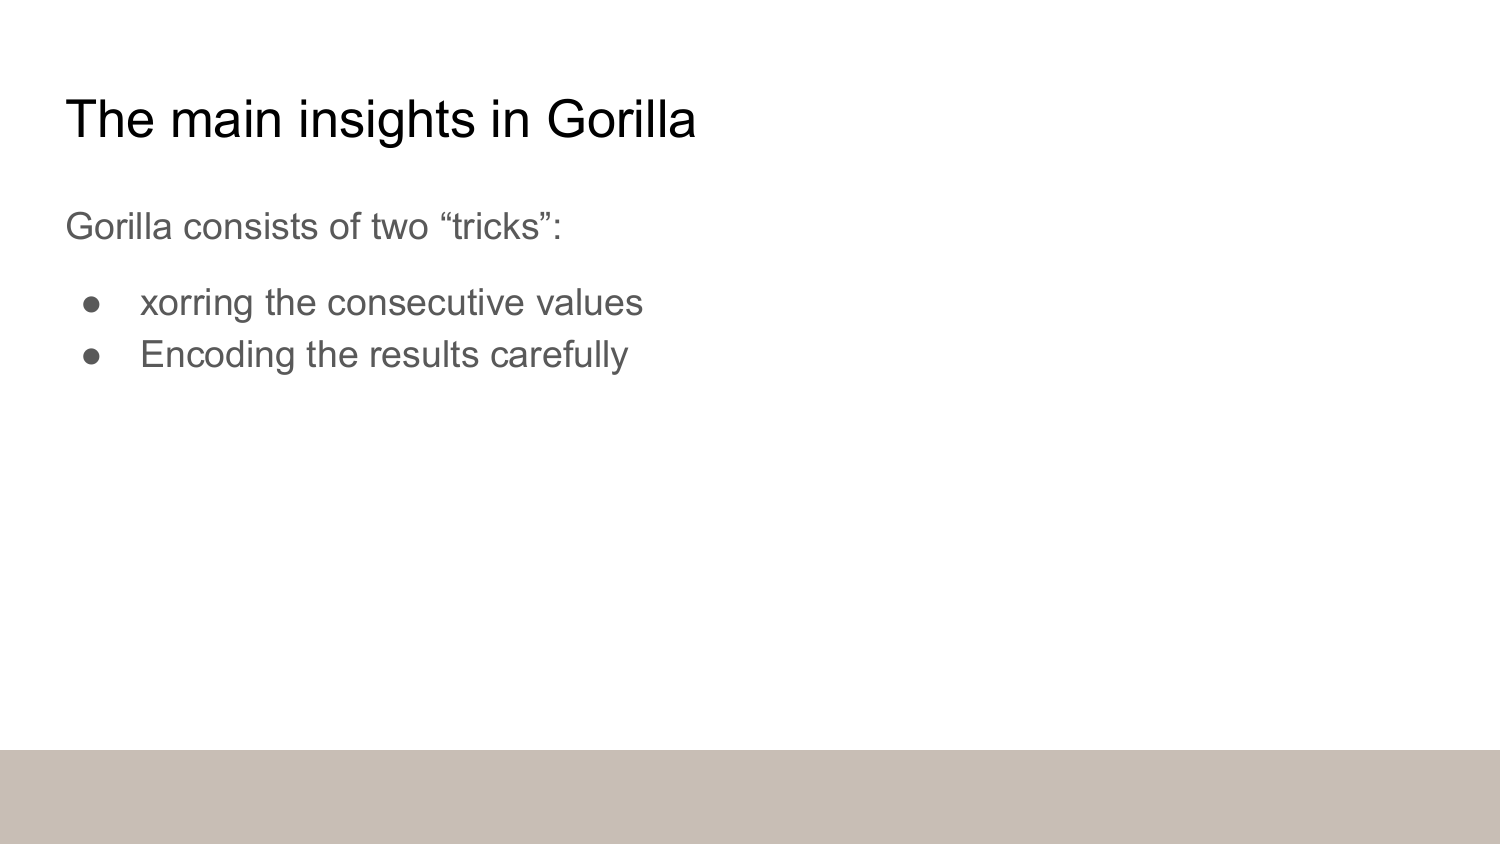
Now we’re ready to talk about the algorithm!
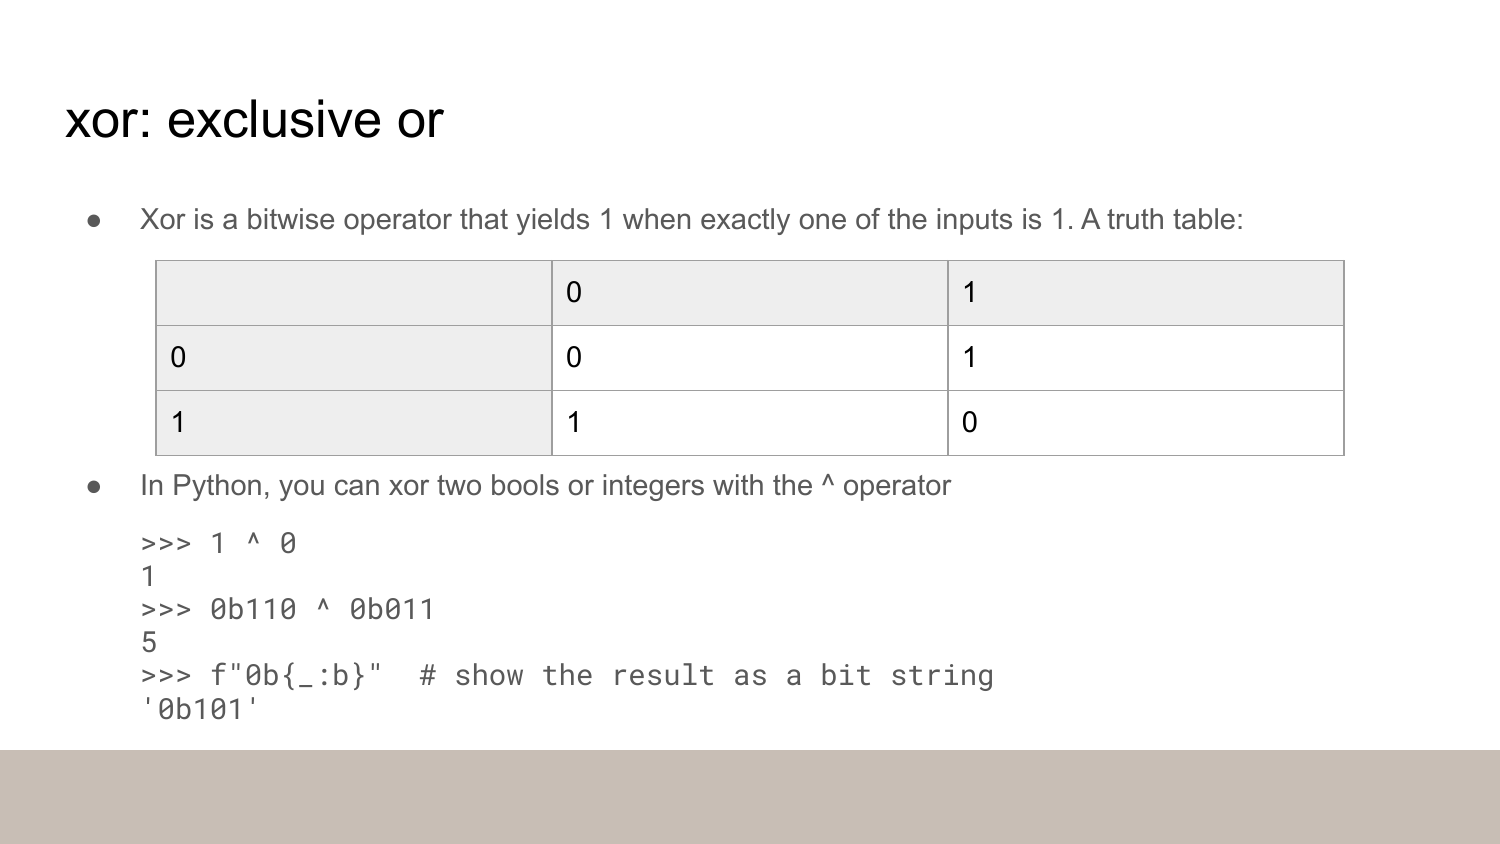
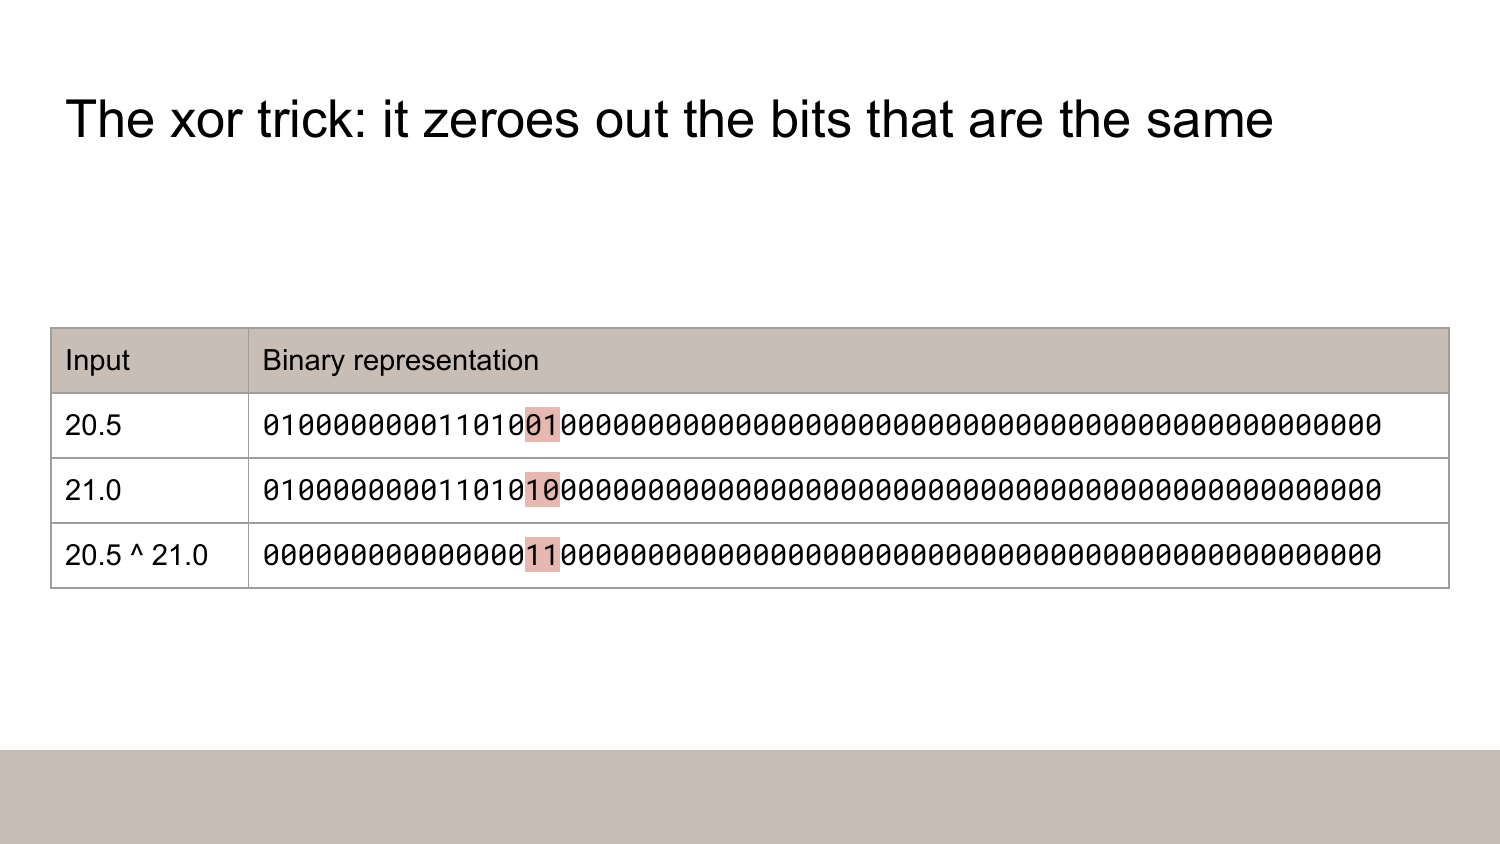
The second column shows the binary representation for the inputs. I made up the syntax in the third row - you can’t actually xor two floats in Python - but I’m using it to mean the xor of the binary representations.
Xor sets the bits that differ to one and the bits that are the same to zero. See the highlighted bits - they are the only two that differ in the inputs.
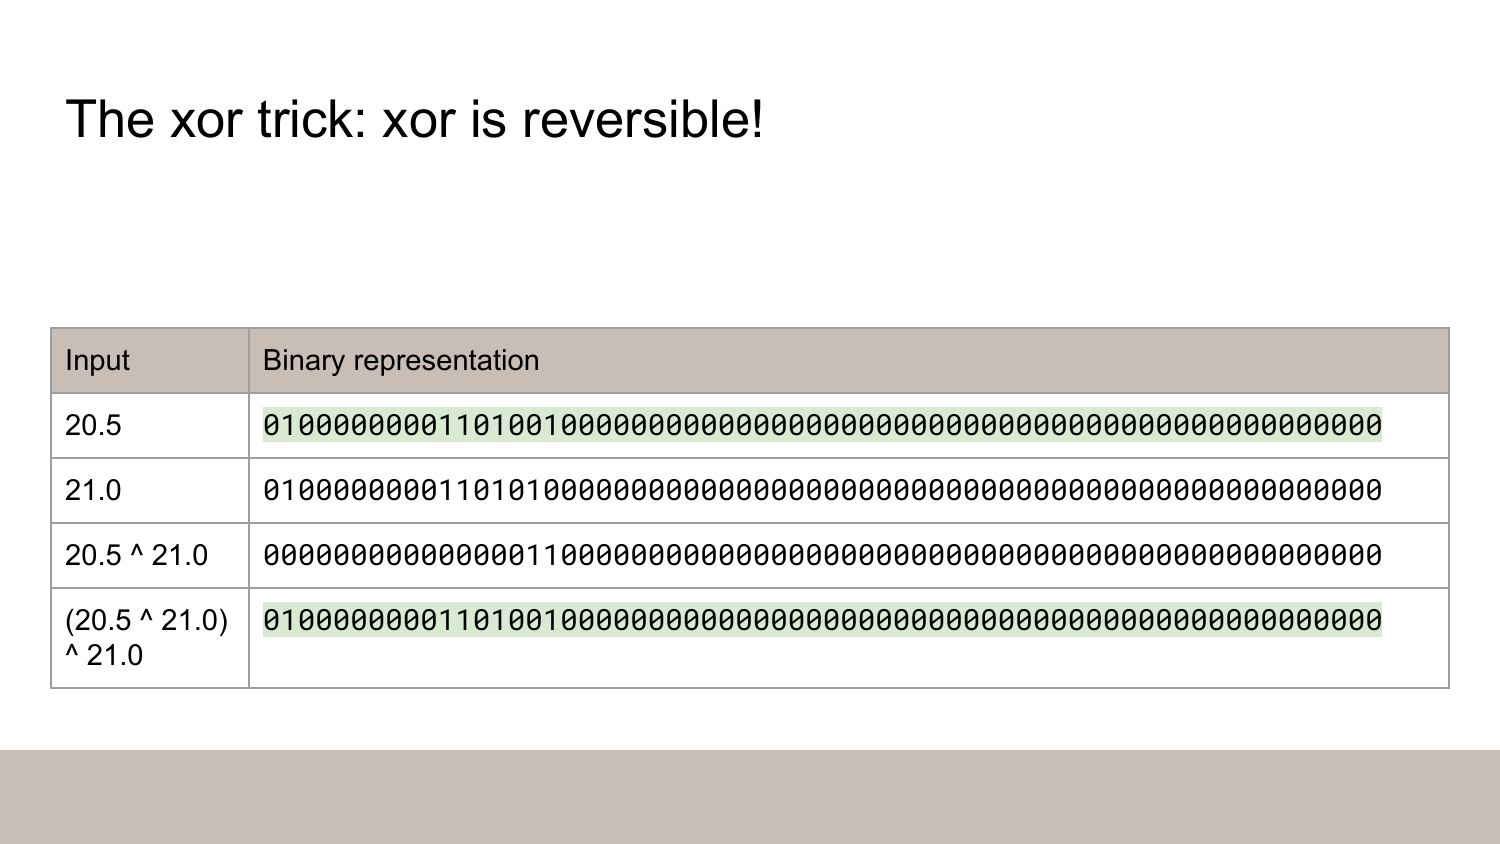
Xor is also reversible. If you xor 20.5 with 21.0 and then xor the result with 21.0 again, you’ll get 20.5 back.
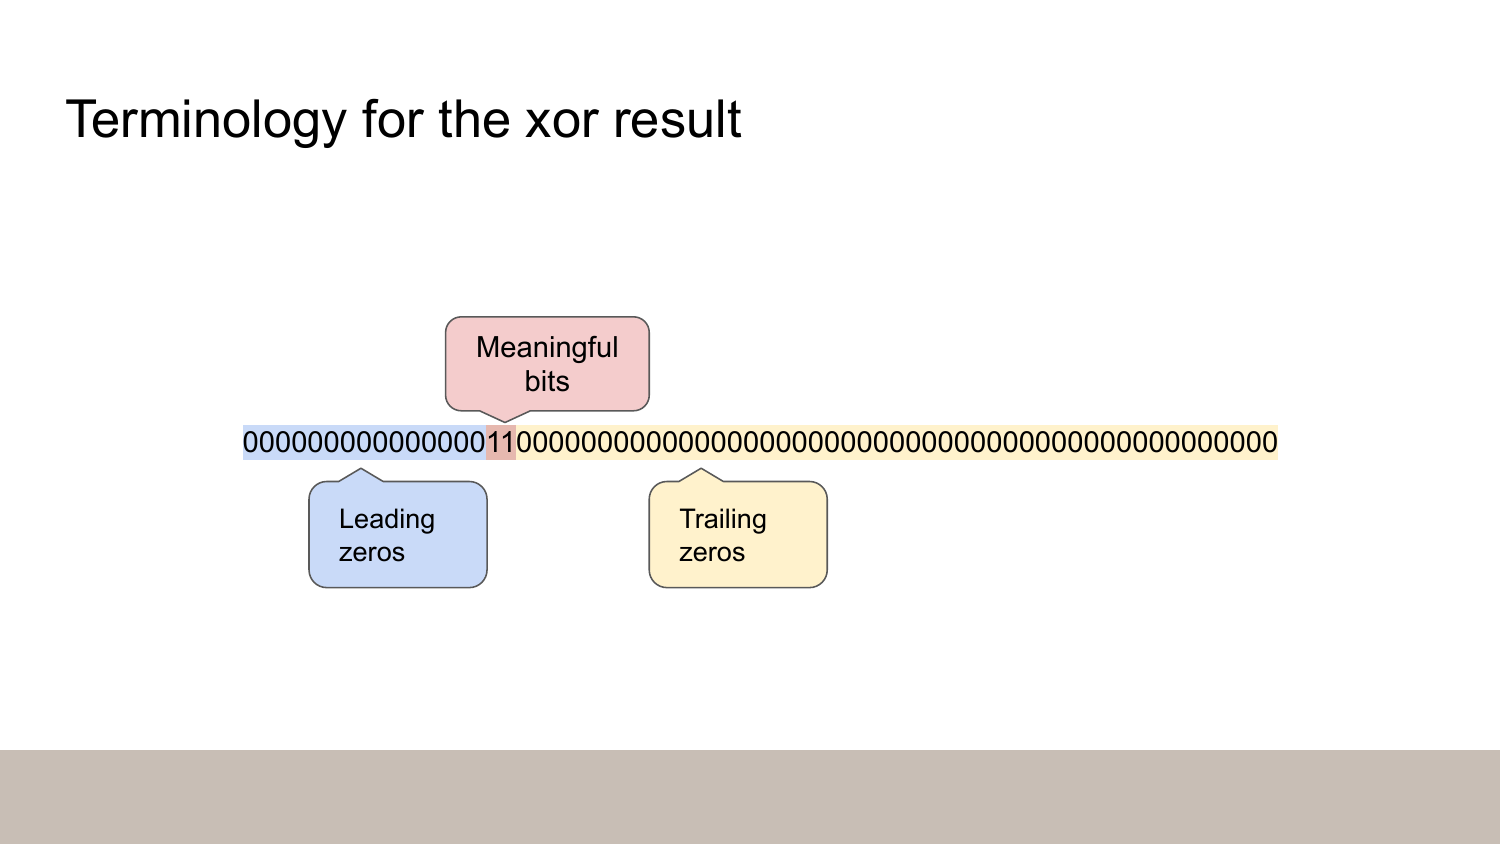
Now if we look at the xor result, we can see there’s a run of leading zeros. Then there’s a handful of meaningful bits. Now it’s just two ones but there could be some zeros in the middle. And finally there’s a run of trailing zeros.
Here’s how we’re going to encode this: we’re going to store the number of zeros instead of the actual zero bits.
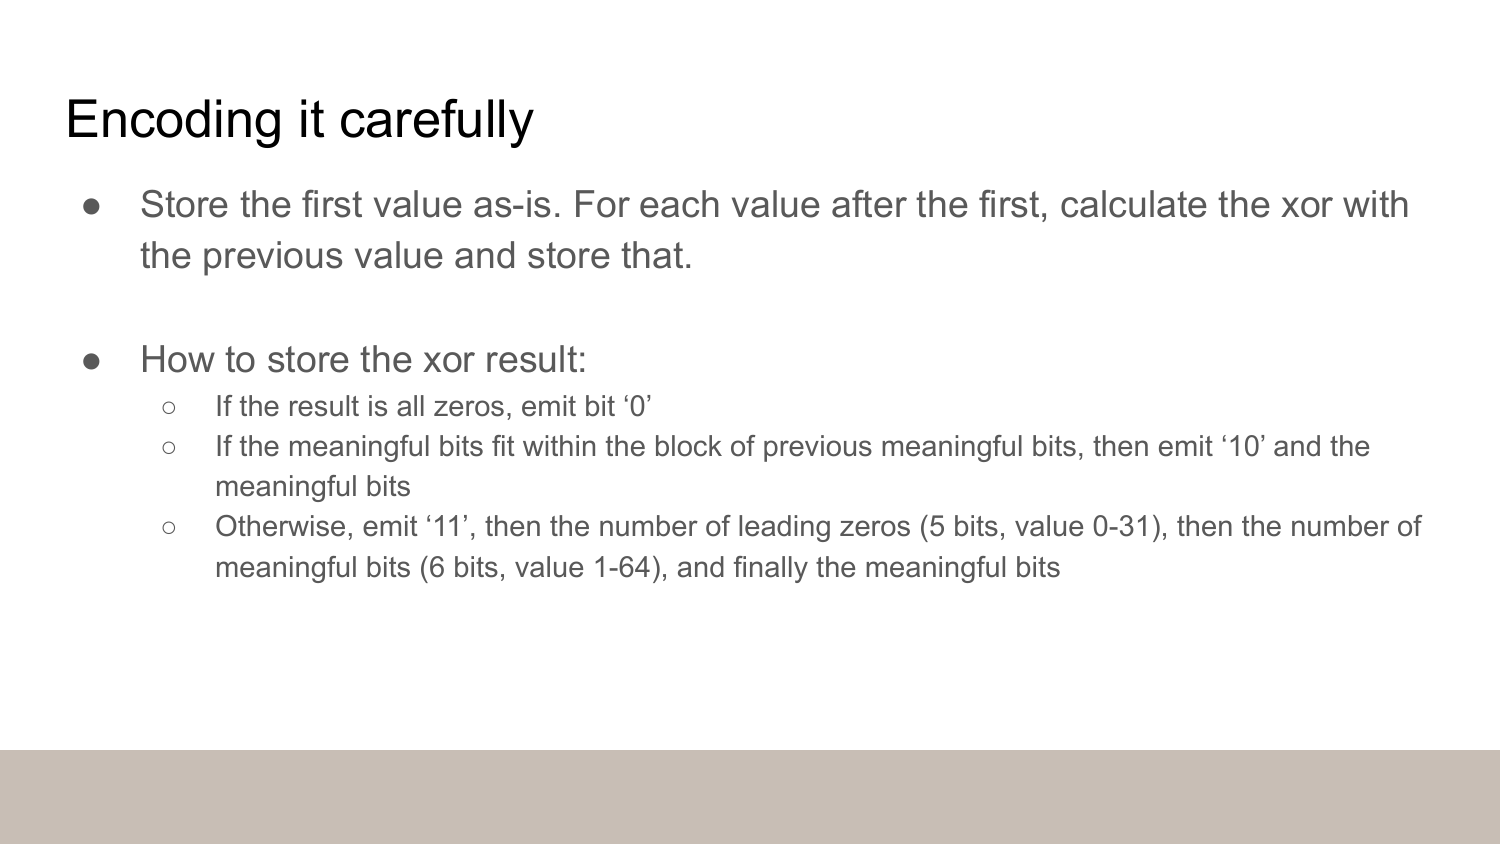
We’re going to store the first value as-is and then for the remaining values, the value xorred with the previous value. Since xor is reversible, we can revert this process when we’re decoding the data.
Then we encode the values as described in the slides.
In the second case (control bits 10), the precise condition is that the number of leading zeros is the same or greater than in the previous value and the number of trailing zeros is the same.
If you have more leading zeros than in the previous value, you will have to include those zeros in the meaningful bits.
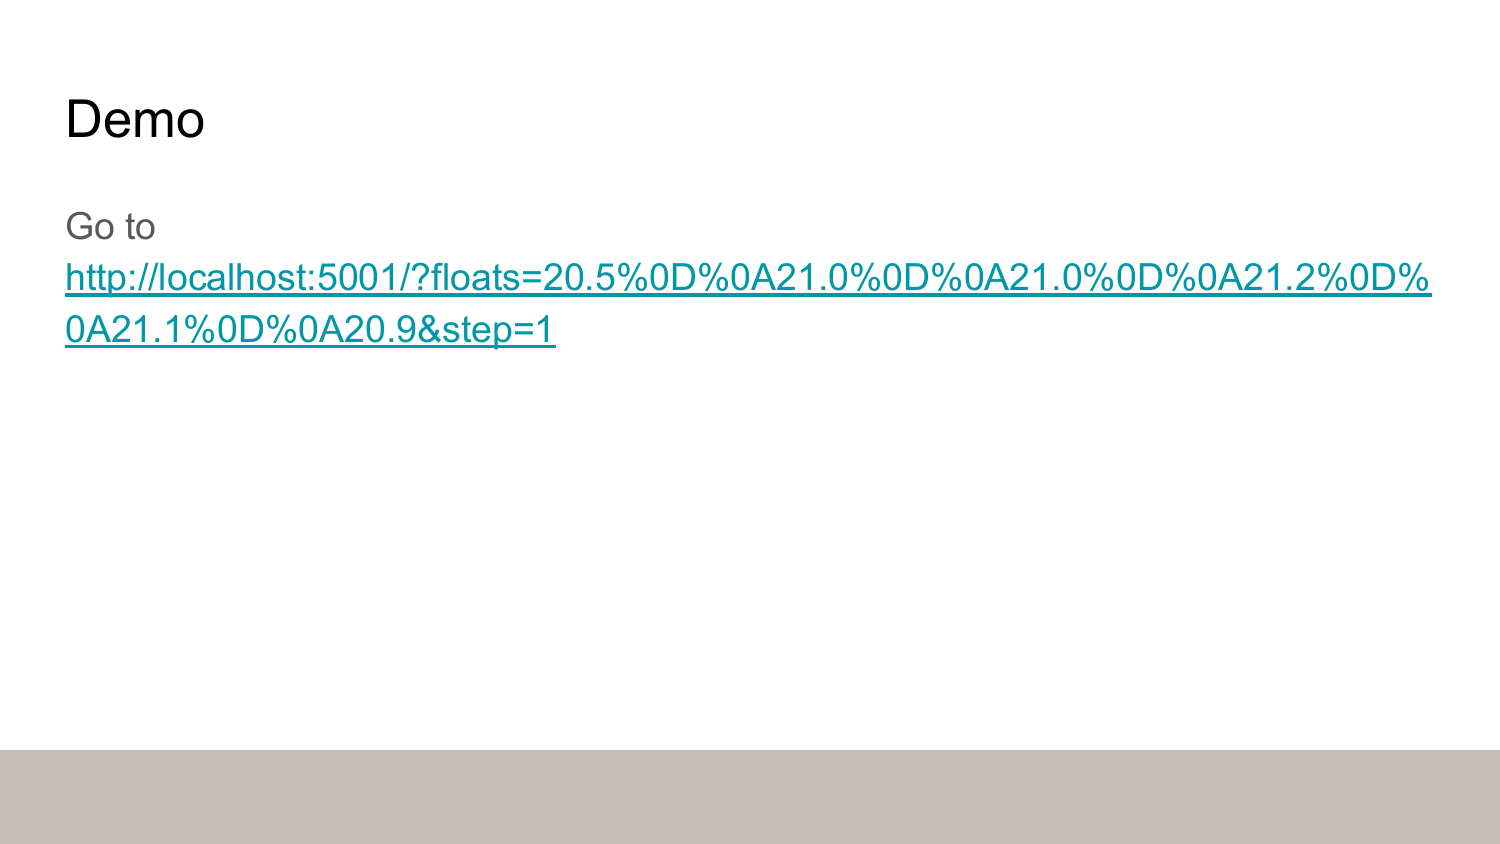
Link: https://miikka.github.io/python-gorilla/?floats=20.5%2021.0%2021.0%2021.2%2021.1%2020.9
Okay, sorry blog readers, this part would really benefit from a screencast with me gesturing at things.
This is a playground that you can use to see the algorithm in action.
Use it to step through the compression of the values 20.5 21.0 21.0 21.2 21.1 20.9.
- The input is in the first column and the output is in the third column.
- The second column shows the binary representation. The first value is as-is and the remaining values have been xorred with the previous value.
- You can hover the highlighted blocks to see what they mean.
Background color guide for the highlighted blocks:
- Green: control bits
- Orange: the number of leading bits
- Violet: the number of meaningful bits
- Navy: the meaningful bits themselves
In the last step you can see that the compressed data uses 41.17 bits/value. Uncompressed data would use 64 bits/value.1 Is this good performance? We’ll return to this question in a moment.
Note how the changing bits are mostly in the middle or on the right-hand side.
Link: https://github.com/miikka/python-gorilla. See the implementation and the test suite.
- The implementation, including encoding and decoding, is just a bit over 100 lines, so you can see it’s a fairly simple algorithm. The algorithm uses little memory since all the state it needs to keep is the previous value.
- I used the bitstring library to do bitwise IO. It was okay, but it’s easy to do the bit twiddling with ints and do the bitwise IO yourself.
- The test suite has just one test but it’s a pretty good one since it’s a property-based test powered by Hypothesis.
How do you know if a compression algorithm is any good? One way to do is to gather a set of data that you want to compress and run benchmark on it, comparing it to other algorithms. I believe Facebook did this, but the Gorilla paper is a bit thin on the results. Luckily there are some later papers that have more informative benchmarks.
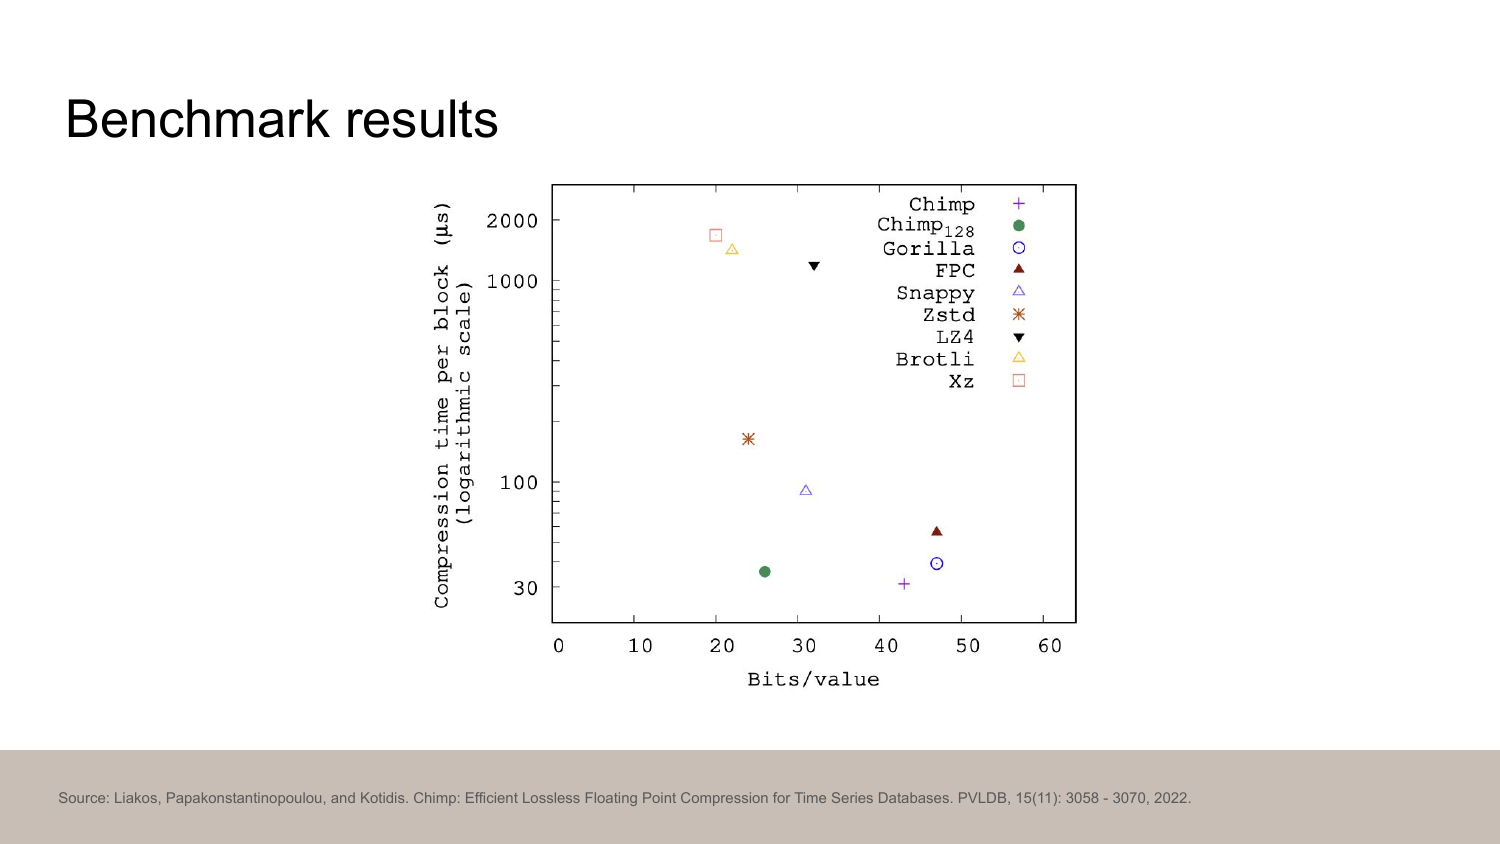
Chimp is an algorithm directly inspired by Gorilla. They ran benchmarks over a number of time series data sets and here’s one of the graphs they produced.
The horizontal axis is bits/value and the vertical axis is how long the compression takes. In both cases, smaller is better.
We can compare Gorilla (blue circle) to Zstd (orange circle), which is a great general purpose compression algorithm. Gorilla seems to produce about twice as many bits and to be four times faster.
Is this a good tradeoff? It could be - you have to decide. In any case, Zstd was published in only 2016, so it did not exist in public when Gorilla was published.
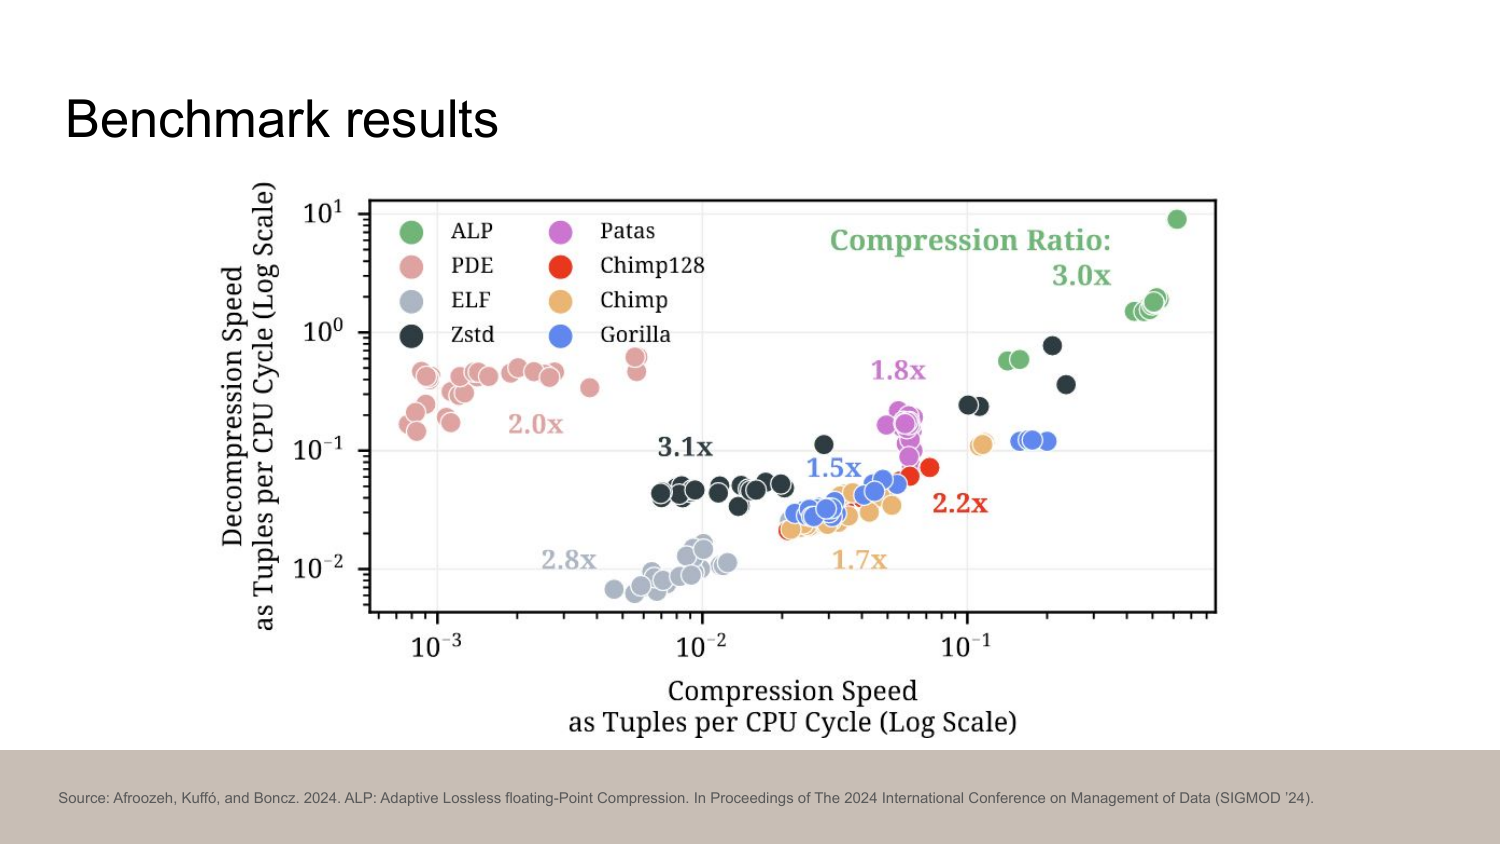
Here’s another benchmark from the ALP paper.
The horizontal axis is decompression speed and the vertical axis is compression speed. The compression rate is in the labels. For all of them, the higher the better. You can see that Zstd (black) seems to actually beat Gorilla (green) in decompression speed.
ALP, published in 2024, is the state of the art algorithm for compressing floats. It’s significantly more complex but it also delivers results. As you can see, it’s right there in the upper-right corner with excellent 3x compression ratio.
The algorithm does not actually make use of the float structure directly, so you can compress any data with it. I have not tried it, but you could compresse your web pages or source tarballs with Gorilla if you wanted, as long as you pad the length to be a multiple of 8 bytes. I expect that the compression ratio is rather poor.
Most of you probably won’t be implementing these Gorilla or Chimp or ALP yourself, but you might be already using some of them indirectly. For example, the analytics database DuckDB implements Chimp and ALP.
Thanks for reading!
-
The astute reader might notice that the string
20.5uses only four bytes, or 32 bits, whereas storing it as a float uses 8 bytes, or 64 bits. Another idea for a compression algorithm right there! ↩︎